AVIATION'S NEW ERA
|
|
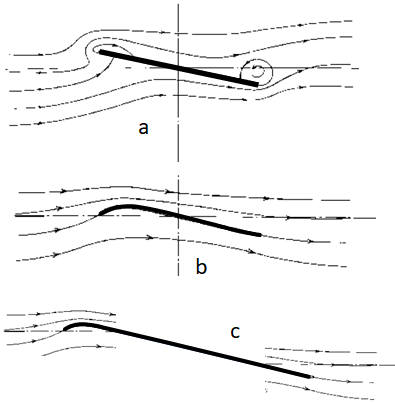
Figure 4. Illustration of turbulence on flat plate airfoil. Table 3. L/D values versus H/L (rows) and air's angle of attack (columns).
Air's angle of attack is in degrees (top row) and radians (2nd row).
Air's angle of attack is in degrees (top row) and radians (2nd row).
Chapter 4. Science of Optimization
The ideal flat plate airfoils L/Ds from 57 to 114 at air angles of attack from 1° to 0.5°, optimal designs will have L/Ds from 50 to 100 due to shear drag and leading-edge effects. The estimates of these forces are common-place and reasonably accurate as summarized in the following paragraphs.
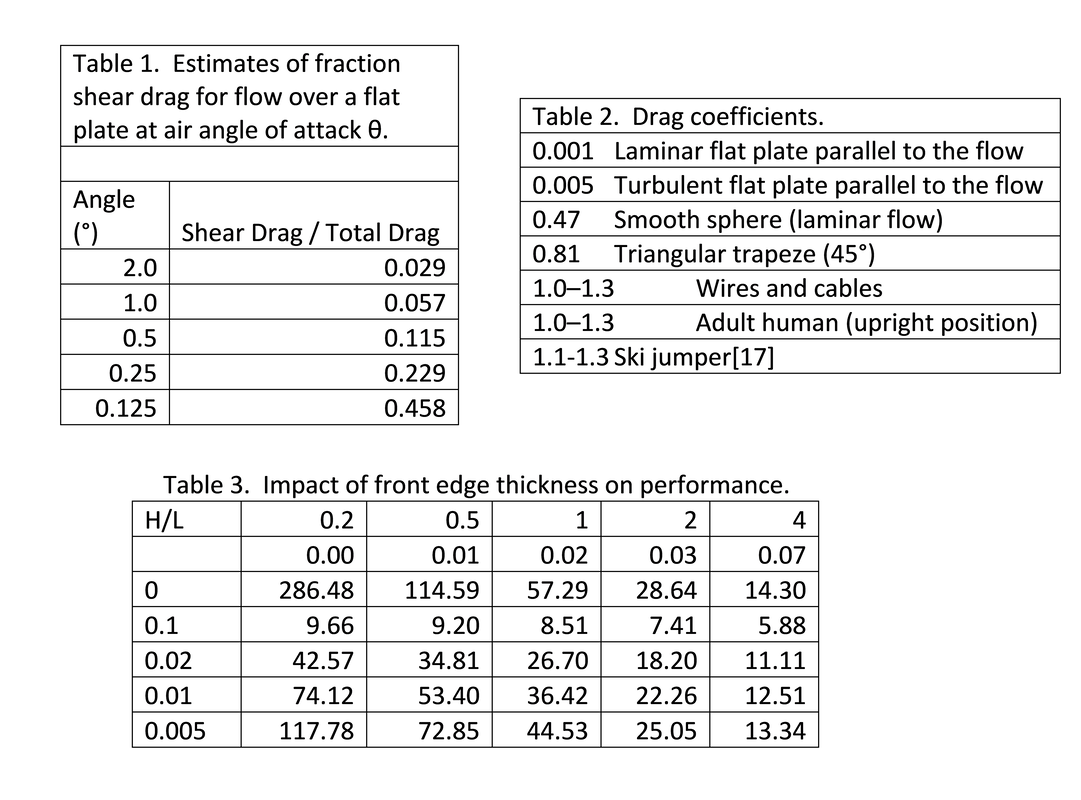
Shear Drag - Shear drag coefficients are about 0.001 for laminar flow to 0.005 for turbulent flow. These coefficients are multiplied times area (“A”) and density times velocity squared (“ρ v2”) to estimate the shear drag, which is a force parallel to a surface. In this case, “A” is the total surface area versus a projected frontal surface area that is commonly used for form drag. For laminar flow over a rectangular plate, the laminar shear drag is 0.001 ρ L W v2. The form drag is a function of air’s angle of attack and is sin(θ) ρ L W v2.
When air’s angle of attack is 0, form drag goes to zero and shear drag is greater than form drag. However, as summarized by Table 1, at air angles of attack greater than 0.5°, shear drag is less than ~10% of the total drag. Shear drag reduces the ideal L/D by 5%-10% less than at air angles of attack from 1° to 0.5°, The impact of turbulence is discussed later in this chapter.
The finding that shear drag tens to be small to negligible is consistent with the ability of the Eta Glider to attain L/D up to 70. Operating with negligible shear drag is achieved with smooth surfaces. Shear drage does limit the ability of flat plate airfoils to attain L/D greater than about 150.
Leading and Trailing Edges – The ideal flat plate airfoil has negligible thickness which over-estimates L/D due to the thicknesses of the front edges. The impact of the thickness can be estimated using drag coefficients as defined by Equation 3.
Fd = 0.5 cd A (ρv2) (where ρ is density) (3)
For rough estimates, the drag coefficient (cd) is taken as 1.0 and the area (A) is the projected frontal area. The projected frontal area of the flat sheet will have a leading edge of area H W and the projected area of the flat surface of sin(θ) L W, where θ is the air’s angle of attack. The overall drag force is a function of velocity. The corrected L/D estimate is:
L/D = cos(θ) /[sin(θ) + H/L].
Table 3 summarizes the impact of the front edge on performance. The results narrow in on conditions where L/D can be greater than 70; and a key design parameter is the front edge thickness. The optimal conditions are for air’s angle of attack near 0.5° and H/L near 0.005 with an L/D of 73.
A design under development is the towed platform “train” where a series of airfoil compartments are tethered for flight, minimizing front edge portfolio and increasing length and carrying capacity. An implicit purpose of the towed platform “train” design is to minimize front edge effects by having sequential platforms in contiguous streamlines of the lead aircraft. An additional insight from this analysis is the need for flexibility along the length as a robust aspect of design, which is needed for low thickness vehicles.
Further discussions on this topic will be available in Chapter 7.
Impact of Turbulence – Surfaces, forces, and weather that cause a change in air flow patterns can disrupt laminar flow. Turbulence can increase shear drag and even cause air’s momentum to counter desirable conditions for creating aerodynamic lift. Figure 4A illustrates how turbulence on the trailing edge of a flat plate airfoil can create changes in momentum that counterproductively pushes down on upper surfaces of an airfoil.
Undesirable turbulent flow can occur on all four edges (front, sides, and back) of a rectangular flat plate airfoil as higher pressures under the plate cause air to flow to lower pressures above the plate. Figure 6 illustrates how a deviation on a lower surface of an airfoil can create a force for flow toward each of the edges.
Figures 4B and 4C illustrate approaches to overcome turbulence on fore and aft edges by adding a camber on the leading edge. Of particular importance in this approach is a design where the split of streamlines (i.e., flow over versus flow under the airfoil) in front of the airfoil is at approximately the same vertical position as the joining of streamlines aft the airfoil.
This turbulent overflow impacts the side edges of the airfoils as well. Typical approaches used on lateral ends of wings to eliminate this turbulence include: a) having the leading and trailing edges meet at a tip to reduce/eliminate surfaces impacted by side edge turbulence and b) using upturned winglets to block the turbulence-inducing air flow.
The approaches applied to contemporary wings provide a starting point of optimization of airfoil “platforms” which have much lower span-to-chord ratios than laterally-extending wings.
Summary of the Science – When the flat plate airfoil is corrected for shear drag and leading-edge form drag, the L/D values may be compared to traditional airfoil performances. Experimental data has verified that aircraft can approach the performance of traditional airfoils under laminar flow conditions. For example, the Eta Glider is reported to have an L/D of 70:1; which is about 90% of the L/D of the airfoil without the fuselage. The Eta Glider and similar lightweight wide-wingspan aircraft tend to be rather fragile, limited to slower velocities, and incapable of achieving the higher L/D values attainable by of flat plate airfoils.
The ideal flat plate airfoils L/Ds from 57 to 114 at air angles of attack from 1° to 0.5°, optimal designs will have L/Ds from 50 to 100 due to shear drag and leading-edge effects. The estimates of these forces are common-place and reasonably accurate as summarized in the following paragraphs.
Shear Drag - Shear drag coefficients are about 0.001 for laminar flow to 0.005 for turbulent flow. These coefficients are multiplied times area (“A”) and density times velocity squared (“ρ v2”) to estimate the shear drag, which is a force parallel to a surface. In this case, “A” is the total surface area versus a projected frontal surface area that is commonly used for form drag. For laminar flow over a rectangular plate, the laminar shear drag is 0.001 ρ L W v2. The form drag is a function of air’s angle of attack and is sin(θ) ρ L W v2.
When air’s angle of attack is 0, form drag goes to zero and shear drag is greater than form drag. However, as summarized by Table 1, at air angles of attack greater than 0.5°, shear drag is less than ~10% of the total drag. Shear drag reduces the ideal L/D by 5%-10% less than at air angles of attack from 1° to 0.5°, The impact of turbulence is discussed later in this chapter.
The finding that shear drag tens to be small to negligible is consistent with the ability of the Eta Glider to attain L/D up to 70. Operating with negligible shear drag is achieved with smooth surfaces. Shear drage does limit the ability of flat plate airfoils to attain L/D greater than about 150.
Leading and Trailing Edges – The ideal flat plate airfoil has negligible thickness which over-estimates L/D due to the thicknesses of the front edges. The impact of the thickness can be estimated using drag coefficients as defined by Equation 3.
Fd = 0.5 cd A (ρv2) (where ρ is density) (3)
For rough estimates, the drag coefficient (cd) is taken as 1.0 and the area (A) is the projected frontal area. The projected frontal area of the flat sheet will have a leading edge of area H W and the projected area of the flat surface of sin(θ) L W, where θ is the air’s angle of attack. The overall drag force is a function of velocity. The corrected L/D estimate is:
L/D = cos(θ) /[sin(θ) + H/L].
Table 3 summarizes the impact of the front edge on performance. The results narrow in on conditions where L/D can be greater than 70; and a key design parameter is the front edge thickness. The optimal conditions are for air’s angle of attack near 0.5° and H/L near 0.005 with an L/D of 73.
A design under development is the towed platform “train” where a series of airfoil compartments are tethered for flight, minimizing front edge portfolio and increasing length and carrying capacity. An implicit purpose of the towed platform “train” design is to minimize front edge effects by having sequential platforms in contiguous streamlines of the lead aircraft. An additional insight from this analysis is the need for flexibility along the length as a robust aspect of design, which is needed for low thickness vehicles.
Further discussions on this topic will be available in Chapter 7.
Impact of Turbulence – Surfaces, forces, and weather that cause a change in air flow patterns can disrupt laminar flow. Turbulence can increase shear drag and even cause air’s momentum to counter desirable conditions for creating aerodynamic lift. Figure 4A illustrates how turbulence on the trailing edge of a flat plate airfoil can create changes in momentum that counterproductively pushes down on upper surfaces of an airfoil.
Undesirable turbulent flow can occur on all four edges (front, sides, and back) of a rectangular flat plate airfoil as higher pressures under the plate cause air to flow to lower pressures above the plate. Figure 6 illustrates how a deviation on a lower surface of an airfoil can create a force for flow toward each of the edges.
Figures 4B and 4C illustrate approaches to overcome turbulence on fore and aft edges by adding a camber on the leading edge. Of particular importance in this approach is a design where the split of streamlines (i.e., flow over versus flow under the airfoil) in front of the airfoil is at approximately the same vertical position as the joining of streamlines aft the airfoil.
This turbulent overflow impacts the side edges of the airfoils as well. Typical approaches used on lateral ends of wings to eliminate this turbulence include: a) having the leading and trailing edges meet at a tip to reduce/eliminate surfaces impacted by side edge turbulence and b) using upturned winglets to block the turbulence-inducing air flow.
The approaches applied to contemporary wings provide a starting point of optimization of airfoil “platforms” which have much lower span-to-chord ratios than laterally-extending wings.
Summary of the Science – When the flat plate airfoil is corrected for shear drag and leading-edge form drag, the L/D values may be compared to traditional airfoil performances. Experimental data has verified that aircraft can approach the performance of traditional airfoils under laminar flow conditions. For example, the Eta Glider is reported to have an L/D of 70:1; which is about 90% of the L/D of the airfoil without the fuselage. The Eta Glider and similar lightweight wide-wingspan aircraft tend to be rather fragile, limited to slower velocities, and incapable of achieving the higher L/D values attainable by of flat plate airfoils.